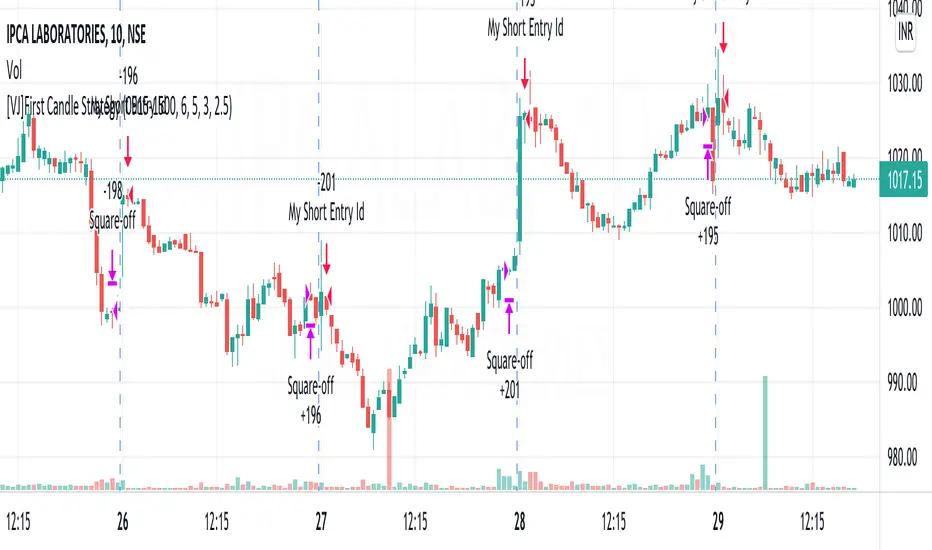
[VJ]First Candle StrategyHello Traders, this is a simple intraday strategy involving the first candle of the day with an additional twist to the traditional style . You can modify the time of candle on the stock and see what are your best picks. Comment below if you found something with good returns
Strategy: Observe the first candle of the day within any time frame. 15m works best. If the first candle is RED ,then go for buy side for the rest of the day. You could square off at close of session or have a fixed take profit and stop loss. This is a contrarian indicator where people just use this as their first entry for the day. The same holds good when a Green candle is seen you go short side.
There is stop loss and take profit that can be used to optimise your trade
The template also includes daily square off based on your time.
Cerca negli script per "stop loss"
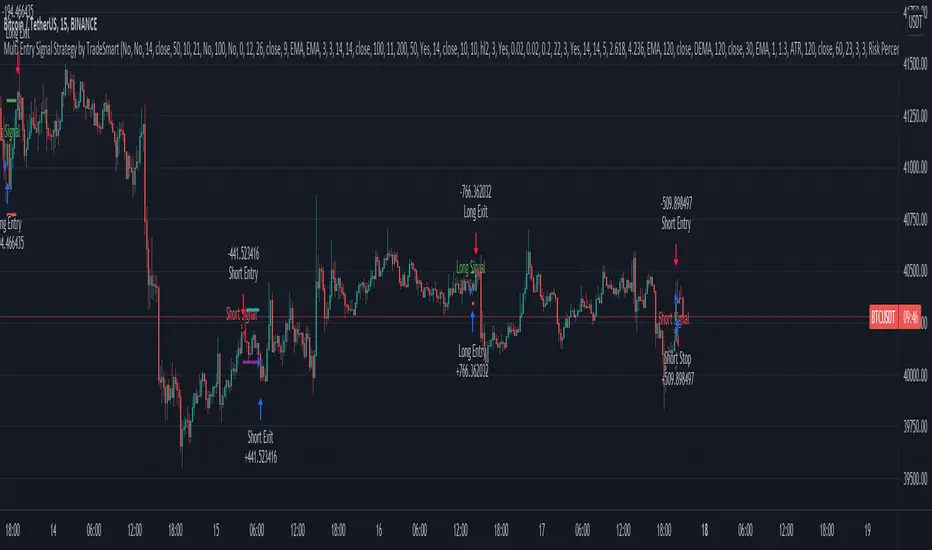
Multi Entry Signal Strategy by TradeSmartThis strategy is intended to test different entry signals. You can use 13 different entry signals in the strategy.
Available signals with all their settings:
Heikin Ashi
RSI + EMA
Wavetrend
MACD
Stochastic RSI
Squeeze Momentum
Kairi Relative Index
SSL
Supertrend
Parabolic SAR
Chandelier Exit
Directional Movement Index
Quantitative Qualitative Estimation
For exact rules of entries please relate to the tooltips of each entry signal. All the signals can be used together or separately in the strategy.
Additional settings that can be used:
Trend Filter (limit long or short entries based on a moving average of your choice)
Exit Strategy settings (ATR is used to determine stop loss and take profit levels)
Trailing Loss Setups (you can use 3 different types of trailing losses)
Setups (you can set Long and Short entries as well as the order size based on either Capital % or Risk %)
Date Range (you can limit trades to specific date ranges)
Trading Time (you can limit on which days to trade)
RSI StrategyThis RSI strategy will allow you to go long when RSI is overbought and go short when RSI is oversold. You can also change the checked boxes to reverse this. Uncheck "Overbought Go Long & Oversold Go Short" and check "Overbought Go Short & Oversold Go Long" to use this reversed option.
You can also choose to use an ema filter as an additional qualifier for entry. Uncheck "No EMA Filter" and check "Use EMA Filter" if you want to use it.
Be sure to enter slippage and commission into the properties to give you realistic results.
I've also built in backtesting date ranges and the ability to trade only within certain times of day and have it close all trades at the end of that time frame. This is especially useful for day trading stocks. To specify a time from use the format 0930-1100 or whatever your trading hours will be. Check off "Enable Close Trade At End Of Time Frame" to close the trade at the end of your trading hours.
You can also specify a % based take profit and stop loss. Also keep in mind that the way this code is designed if you use the stop loss and/or take profit and it reaches either target and closes, then it will immediately re-enter if the condition for long or short entry is true.
Finally there's custom alert fields so you can send custom alert messages for strategy entry and exit for use with automated trading services. Simply enter your messages in the fields within the strategy properties and then put {{strategy.order.alert_message}} in your alert message body and it will dynamically pull in the appropriate message.

CCI StrategyThis CCI strategy will allow you to enter a long or short off a CCI zero line cross or control entries and exits from custom upper and lower band lengths. You can set a custom upper band which it will buy when it crosses up and then a custom upper band exit which it will sell when it crosses down. For a short you can set a custom lower band which it will short when it crosses down and the custom lower band exit which it will exit the short when it crosses up. Be sure to enter slippage and commission into the properties to give you realistic results.
I've also built in backtesting date ranges and the ability to trade only within certain times of day and have it close all trades at the end of that time frame. This is especially useful for day trading stocks. If you check off "Enter First Trade ASAP" then when using the time frame option it will enter the current trade. If however you uncheck that box and instead check off "Wait To Enter First Trade" it will wait for the trend to change and then enter.
You can also specify a % based take profit and stop loss. Also keep in mind that if you have "Enter First Trade ASAP" checked off and use the stop loss and/or take profit then it will re-enter the current trend again.
Finally there's custom alert fields so you can send custom alert messages for strategy entry and exit for use with automated trading services. Simply enter your messages in the fields within the strategy properties and then put {{strategy.order.alert_message}} in your alert message body and it will dynamically pull in the appropriate message.

MATIC/USD 1H Bot for 3commas (works w/o 3commas too)This is a MATIC/USD or USDT specific implementation of my BNB/USD 1 hour bot. It should work out of the gate correctly for MATIC, at least based on what has been happening with it for the past seven weeks. You can fiddle with the following settings using the gear icon:
Fast and slow MACD length
The decision to use RSI thresholds as requirements for buys and/or sells, as well as the chart timeframe to use for that (make sure you use the same timeframe as your chart or a higher timeframe. You don't want to use a 1m RSI on a one hour chart but you can use a 4 hour RSI on a 1 hour chart with no issues.)
Buy and/or sell RSI threshold limits
Trailing stop loss %
Start date (for backtesting, I usually leave mine with 1-2 months trailing as those are usually better indicators than how they would have performed over the past few years)
Stress levels
Moving Average length and type
Linear regression amount
The gist of this bot is that it will use a smoothed EMA to make informed buys and sells. The smoothing prevents most noise from affecting your orders. It also allows you to set a trailing stop loss. If you don't want to use this feature set the value to 100 and it will effectively disable it.
Finally, you can disable RSI threshold point visibility. This won't affect bot operation, it just makes it cleaner to look at on your chart. Disabling RSI buys or sells will also disable visibility.
This bot takes a shotgun strategy to buys and sells. It makes a lot of buys and the majority of them are closed with little to no movement up or down. However, the ones that are profitable make a LOT as you will see once you start testing.
I make the full version of these bots available (though the script is protected) so users can test them, however if you want to use it with 3commas you will need access to the full script. Message me if you want the code and we can figure something out.

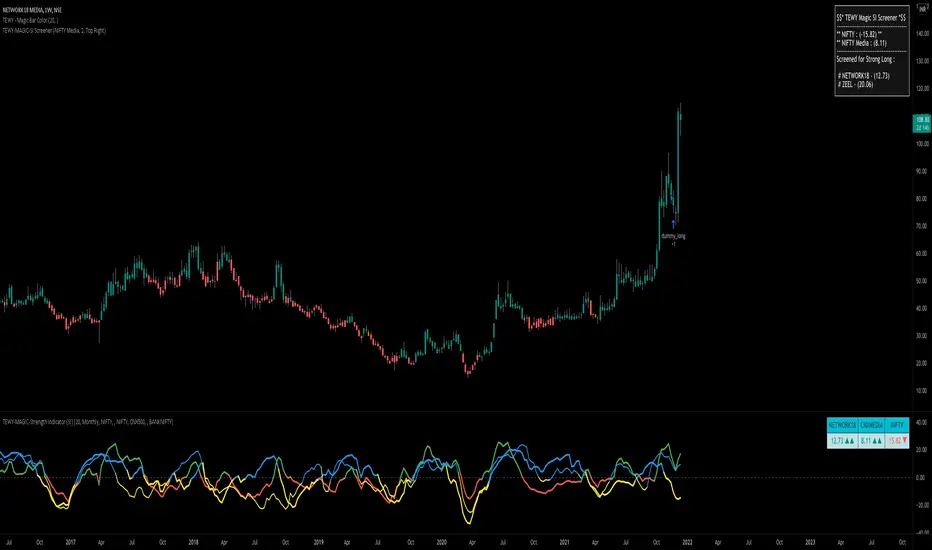
TEWY - Magic Strength Indicator (SI) ScreenerDetail about this indicator
This is screener to identify outperforming Stocks/Ticker based on the indicator "TEWY - Magic Strength Indicator (SI)" I deployed earlier. So please checkout that indicator description to understand more about this screener logic.
Below are the parameters that you may need to use to get outperforming indices/tickers.
1. Screener Set Name :
• Here you can see few of the predefined Index/Ticker sets i created, which you can use to screen Index/Ticker.
• If you select Set for 'Indices' you will get the list of Indices which are out performing NSE:NIFTY. Once you know which index is outperforming, then select the Set for that Index which I already given in the dropdown. That you will get the list of outperforming stock under that index.
• If you want to see all scripts of selected Sector Index that are outperforming NIFTY and may or may not be be outperforming Sector index, then please uncheck the box for "Outperforming Child Index Also". This will get you all the list of Stocks/Tickers which are outperforming Main Index NIFTY.
• If you want to see out-performers for specific period of time then change "How Many Outperforming Candles/Bars" as per your choice
• If you want to see under performers for Short trades then select "Find Short Trades" checkbox
• If you want to see the scripts which are just changed there signal then select "Latest Only" checkbox
Always respect RISKS and follow stop loss. In market stop loss is the only friend of yours.
I have given a sample illustrational image below, which should help you understand this indicator.
Best of luck
DMI (Multi timeframe) DI Strategy [KL]Directional Movement Index Strategy
Entry conditions:
- (a) when DI+ > DI- on timeframe #1, and
- (b) Confirmation: when DI+ > DI- on timeframe #2
In the shown example, timeframe1 was same as the chart (1H) and timeframe2 was 1D.
Stop Loss: ATR based trailing stop
About DMI
Can refer to Investopedia for general understanding.
Applications of DMI in this strategy:
- Assumes uptrend when DI+ is above DI- (when green DI+ lines above red DI-), vice versa for downtrend. This is checked in two different timeframes that can be set by user in settings.
- DX is ignored, it doesn't give a direction of the trend. But if DX was applied, it would be a good indicator for quantifying the strength of uptrend/downtrend. This measurement would typically be read along a threshold (i.e. if below 20, then market is likely consolidating). All of these have been commented out (ignored by pinescript's interpreter via //) in the codes, as said; we are not using DX for sake of simplicity.
Visualizations
To make the chart look cleaner, DMI plots have been simplified to just down/up arrows placed at bottom of the chart.
Referring to the example chart:
- Green arrows : when DI+ > DI- for both timeframes, implies uptrend
- Red arrows: other way around (DI+ < DI-), implies downtrend

Simple EMA Crossing Strategy TradeMathSimple EMA Crossing strategy, based on crossover Fast exponential moving average = EMA21 and Slow exponential moving average = EMA55.
Default stop loss is 3%, but you can change it.
Default take profit is 9%, it based on stop loss.
Risk to Reward ratio is 1 to 3.
Strategy was tested on BTCUSDT 1H timeframe and works fine with these parameters.

LPB MicroCycles StrategyWhat it is:
We use the Hodrick-Prescott filter applied to the closing price, and then take the outputted trendline and apply a custom vwap, the time frame of which is based on user input, not the default 1 day vwap . Then we go long if the value 2 bars ago is greater then one bar ago. We sell and color the bars and lines when the if the value of 2 bars ago is less than one bar ago.
Also included:
GUI for backtesting
ATR Based Stop Loss
How to use:
Go long when the indicators suggest it, and use the stop losses to reduce risk.
Best if paired with a volatility measurement (inside candles, average true range , bollingerband%B)
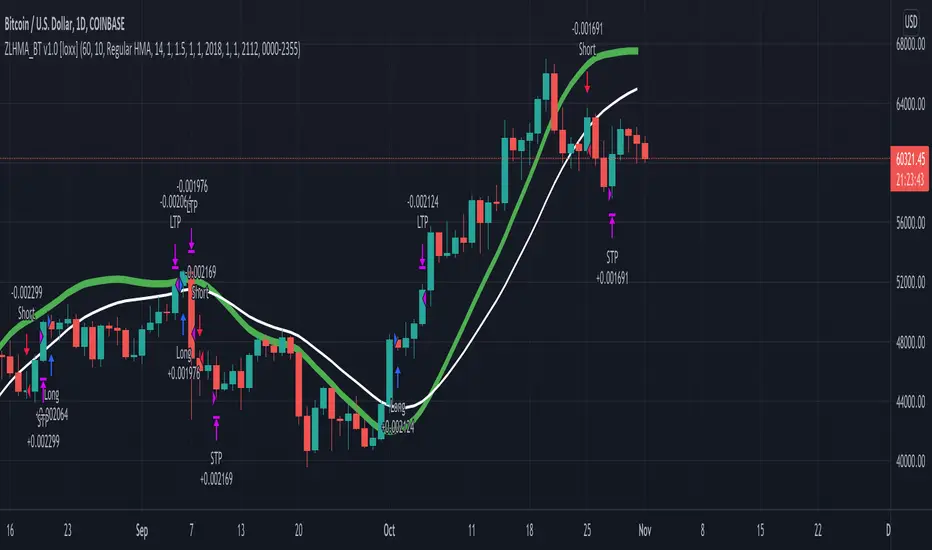
Zero-Lag HMA Backtest v1.0 [loxx]This backtest compares profitability differences between a regular Hull Moving Average ( HMA ) and a Zero-Lag HMA .
Things to know:
- Profit is set to 1 ATR
- Stop-loss is set to 1.5 ATR.
- This is by design to test the minimum the profit scenario (1 ATR up) and the worst case loss scenario (1.5 ATR down) for momentum trading. Actual results vary when additional TPs are added
How to use:
- Adjust settings and dates to view different market structures and position scenarios
- See results in the "Strategy Tester" pane
Conclusions and what's next
- Modifying HMA does very little to improve backtest results
- Future iterations will include options to backtest various moving averages with additional modifiers to improve profits and avoide losses
Comment below or send a PM with questions, comments, observations, or concerns.
BBPBΔ(OBV-PVT)BB - Time Series Decomposition & Volume WeightedThis is an indicator that shows 5 different points of information:
#1 The Trendline is uses a time-series decomposition to remove noise and seasonality data to provide a trendline without using moving averages. This is then further processed by a custom VWAP block that weights it based on the time frame you're currently using.
#2 BB%B - This is the blue histogram that's partially transparent. This is used to find when a security is overbought or oversold.
#3 BB%B of the Δ(OBV-PVT). This is the green histogram. We took the OBV and subtracted the PVT from it, then we found the delta of that compared to the previous candle. This output a line, which we wrapped in bollinger bands to find the BB%B of this line. This line is represented as a histogram, for visual clarity.
#4 Long and Short Indicators: Long is represented by a green dot, and short is represented by a red dot.
#5 Zones - there are multiple zones, which are used to identify overbought and oversold zones.
How to use the indicator:
Simple way: Long on green dot, Short on red dot. Use stop losses and take profits.
Slightly More Complex: Same as above, but also close out longs, when the green histogram drops but the blue does not. As this means price action hasn't caught up with volume. Use stop losses and take profits.
Full Usage: Long only when both the green, blue and yellow lines are below 0, and sell when the blue or green histogram rises above 1. Perform the opposite for the shorting. Ignore the dots if you use this method, they are for simple reference points til you get used to this indicator. Use stop losses and take profits.

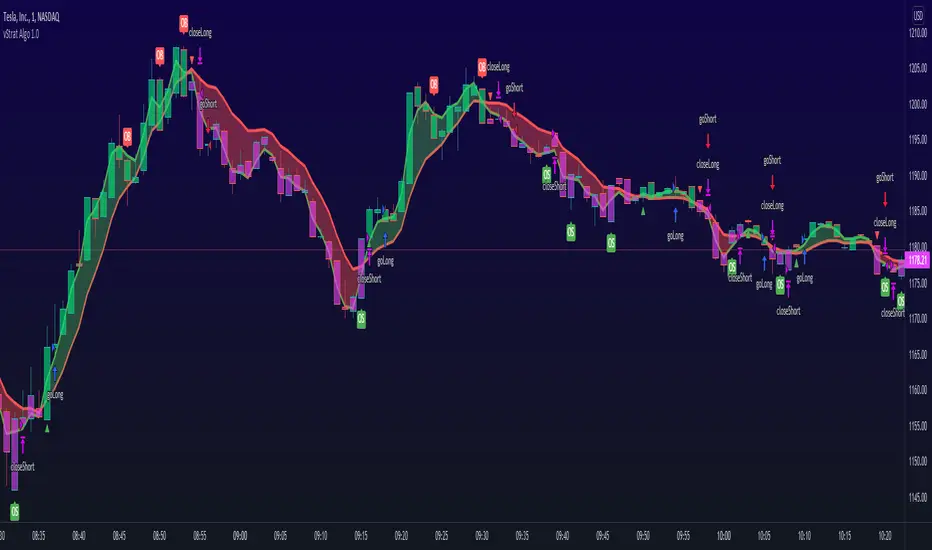
vStrat Algo 1.0 (BETA)vStrat Algo 1.0
The Very First Scalping/Intraday Trading Algo for Options
Note: If you have any favorite indicators that you use regularly and are helpful, feel free to use them in conjunction to this strategy.
Legend:
long = buy call
short = buy put
close entry = sell call/put
BULL = bullish engulfing
BEAR = bearish engulfing
OS = oversold
OB = overbought
Instructions:
1. You can choose to watch the 3 minute or 5 minute chart but be aware of the Pro’s and Con’s. It’s not recommended to use this strategy on the 1 minute chart, but this works on higher timeframes. Keep in mind that the signals will vary on each timeframe.
3 minute 5 minute
i.ibb.co i.ibb.co
2. It’s best to use this strategy right at market open. If a “long” (buy CALLS) or “short” (buy PUTS) signal was given at pre-market, I do not recommend taking it. Only take signals once the market opens. If you really wish to take the signal that was given 1-5 minutes before the market opened, you most definitely can, but its’s just riskier. What I would do is, wait 3-10 minutes after market open and if one Moving Average is respecting the other and holding above or below it, you can enter especially if the blow is bullish, the vStrat Algo 1.0 will also tell you if the candles are bearish or bullish. Use your best judgement.
i.ibb.co [
3. You do not have to wait for the exit signal, everyone's risk management is different so take profits whenever you're green or hold as long as the short-term MA is still trending above or below the long-term MA and is not touching or bouncing off it.
i.ibb.co
4. Avoid taking any signals from 11:30 AM ET - 2:30 PM ET, when stocks are trading sideways since the algo’s stop losses get triggered here due to the low volume.
i.ibb.co
5. Lastly, there is no magic indicator or strategy, this algorithm is designed based on multiple conditions. Each signal gets triggered when ALL the conditions are met. This strategy is based off advanced moving averages, one that reduces lag and responds quicker than the simple and exponential ones, RSI value, S/R, pivot points, and a few others. I’m always looking for ways to improve this scalping algorithm so rest assured any complaints or suggestions will be taken and fixed as timely as possible. For best results, avoid trading with your emotions. If you’re a new user, open a small position, set a stop loss, and let the algorithm decide how you will trade it for that day. Keep doing this until you get more familiar with the script then slowly increase your position sizing, but do not invest money you can’t afford to lose. Play with the settings, change the lengths if you wish, but the script was created to provide the most accurate signals as it is. If you do decide to change these inputs, the signals will also be different. Take profits whenever you see fit, the goal is to have a green day and grow your account slowly but surely. If you make a profit, do not risk giving your money back to the market by overtrading. Always do your own due diligence and use your best judgement. Good luck, Traders!
DISCLAIMER : All information found here, including any ideas, opinions, views, predictions, forecasts, commentaries, suggestions, or stock picks, expressed, or implied herein, are for informational, entertainment or educational purposes only and should not be construed as personal investment advice. While the information provided is believed to be accurate, it may include errors or inaccuracies. Conduct your own due diligence or consult a licensed financial advisor or broker before making any and all investment decisions. Any investments, trades, speculations, or decisions made on the basis of any information found on this site, expressed, or implied herein, are committed at your own risk, financial or otherwise.
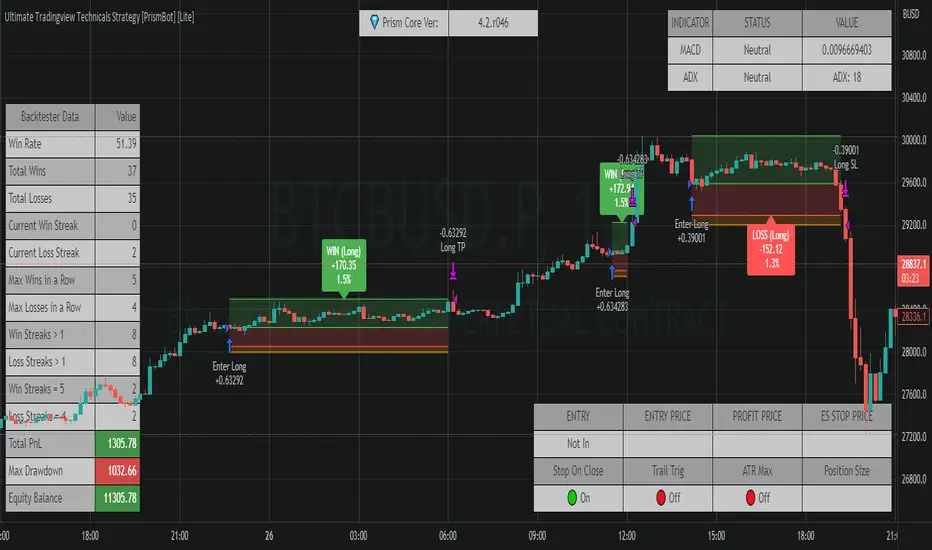
Ultimate Tradingview Technicals Strategy [PrismBot] [Lite]Included in this builder:
MACD
RSI
Tradingview Technical Analysis
Ichimoku
Global Trend Filter
Pullback Filter
Our most robust strategy to date with MACD , RSI , and many other basic strategies included as well as additional filters and alert options.
It is an advanced trading strategy built with the intent to make it easy for anyone to begin trading, but also avoid too much complication of strategy concepts.
For instance, you can change the MACD settings to be "more sensitive" by using a simple dropdown menu, and adjust which strategy you are employing with the MACD on the fly with another.
You can easily enable and disable strategies using the checkbox.
The strategy demo results use 100% equity per trade as an example - the reason for this is that the stop loss is set to 1%, so each trade is risking 1% (give or take slippage). Slippage is set to 5 ticks, and a 0.04% commission (Binance average for market and limit orders)
This strategy incorporates a risk to reward system where the user can select between ATR and Percent based stop losses and take profit targets. This means that the user has much better control over money management when utilizing this strategy and it doesn't require you to babysit the strategy to ensure it's entering and existing strategies in an ideal place.
The status box shows the current state of the various strategies and their values. A red circle indicates the filter / strategy is not valid for entry yet. A green circle indicates that filter / strategy is valid for entry. When all selected strategies are valid simultaneously, the next bar will trigger an entry signal.
If you have any questions about this strategy, please leave them in the comments below, or DM for more details. Thanks!
Additional features in this lite strategy:
✔️ Tweak a multitude of specific settings (MA lengths, R:R, SL distance etc)
✔️ Use money management and risk calculations
✔️ Draw trade info directly to chart (eg. SL size in percent, win rate etc)
✔️ Use various filters (eg. time filter, date filter etc)
✔️ Manage risk per position
✔️ Sync to any bot or algorithmic trading system
SSP + VWMAInput menu allows you to set long / short entries using,
Net volume change from above or below zero.,
Net volume changes of positive to negative values,
VWAP rising or falling.
VWMA rising or falling
Stop loss and take profit are built in to test the most profitable strategy.
uncheck net volume in menu bar to remove background colours on chart
Uncheck VWAP and VWMAto test long and short entries ( using net volume change ) note session look back is available to edit, if use take profit is unchecked then this will simulate net volume change from positive to negative.
Check VWMA or VWAP to simulate long or short entries
With VWAP checked this will simulate VWAP entries with rising / falling VWAP with previous take profit and stop losses that we’re profitable.

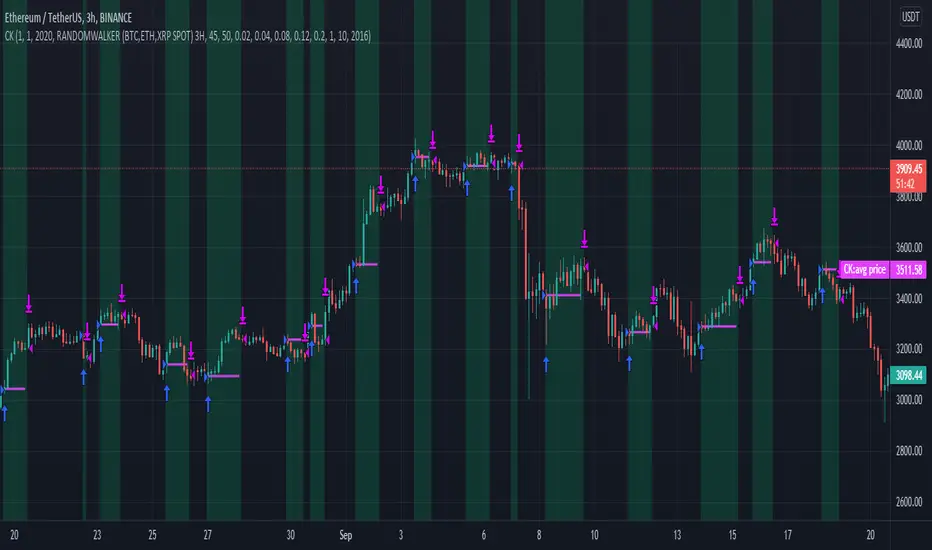
CryptoKillerCryptoKiller is a trend following trading system. It provides entry and exit points, a money management system and a trade management system.
The entry points (fuchsia line) are determined by CryptoKiller Oscillator (see other published script to understand how the oscillator works).
The trade management system provides the exit points in profit and in loss. This script works with multiple take profits (green lines), the initial position is liquidated little by little as the trend reaches the profit targets. Trade management also provides trailing stop exits to save the remaining profits.
Stop loss (red line) take into account the recent past of the chart to be determined, while take profits are fixed and have been calculated based on historical volatility.
The money management system is very simple, it plans to enter a position with a fixed percentage with respect to equity.
CryptoKiller, during an operation, also draws supports and resistances on the chart - determined by the oscillator (orange lines) these supports and resistances are used as a filter to understand where there is the greatest probability of trend development (some entry points provided by the oscillator will therefore not be considered by CryptoKiller as entry points, as in disagreement with the traced supports / resistances).
We know that an error appears in the backtest calculation, where the script is said to suffer from a bias, so the backtest calculation may not be accurate. Actually this happens in high times like H4 or daily, but CryptoKiller is not designed for these timeframes. it is a short-term strategy.
For more information read the author's instructions to contact us, we will send a PDF file with a more complete explanation of the strategy accompanied by screenshots.
Access to this script is granted along with access to CryptoKiller Oscillator.
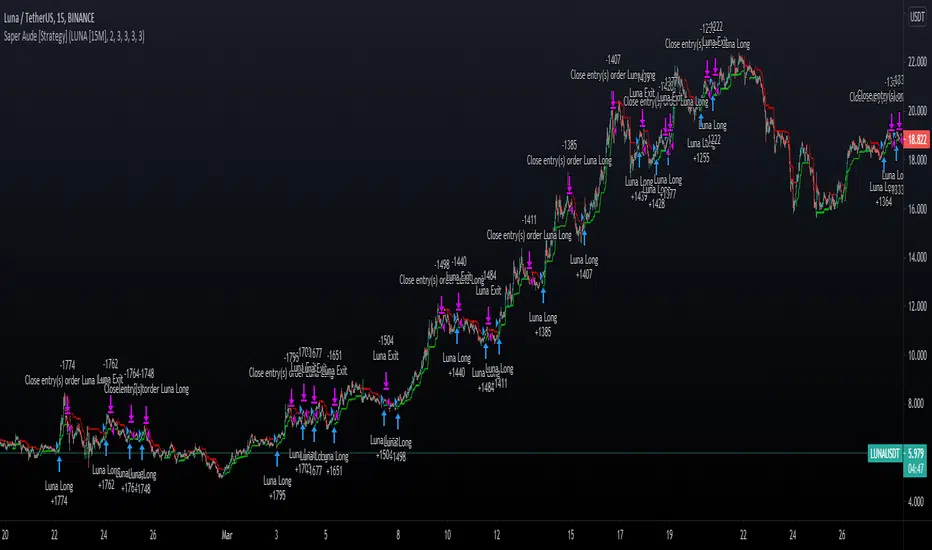
Saper Aude [Strategy]Sapere Aude Strategy
Trend based scalping strategy, to work on lower timeframes (15Minute - 1 Hour)
Calculations on ATR, strategy uses extra conditions to help filter out bad trades.
How to use the strategy?
Simple as when green line shows below, that can be either a good entry point or a signal to start building limit orders on the plot.
I use the ATR as a trailing stop loss for exit.
vica versa for entering shorts. The strategy is only set up to take long positions though.
This is a great scalping strategy for bots in Ranging or up trending markets.
This scripts has 5 variations built within it which are fitted for certain coins & their timeframes
The coins included are
BTC/USDT 1 Hour
ETH/USDT 1 Hour
ADA/USDT 30 Minutes
DOGE/USDT 15 Minutes
LUNA/USDT/15 Minutes
The Strategy backtest results includes Fess and there is NO Repaint! The script is written in Version 4
There is an option in the settings cog to choose from the 5 coins and their timeframes where they have been optimised
There is also an option to change the backtesting range
The stop Losses are also adjustable and listed under the settings
The strategy performs best on the Binance listings
Momentum Trading Strategy (Weekly Chart)The strategy will open position when there is momentum in the stock
The strategy will ride up your stop loss based on the super trend.
The strategy will close your operation when the market price crossed the stop loss.
The strategy will close operation when the line based on the volatility will crossed

Reversal with Bollinger Bands + RSI + ADX + ATR (Upgraded)Hi,
Welcome to my 4th script.
Someone asked me some questions about the Bollinger Band strategy I previously published. When I went back to my published script I couldn't help myself but simply try and make it better. Which I did.
Since I've published that script, I've gained much more knowledge about how Pinescript functions. As well as gaining more and more knowledge about how the markets are structered etc.
In this reversal script we use 4 indicators to determine good entry signals, we determine whether the market is ranging or trending and we still only want to take trades in the direction of the "trend".
Bollinger Bands are used for our entry signal. When price hits either side of the band, we wait for a reverse candlestick before we enter a position.
RSI is used to determine if we're in a trending market or in a ranging market. You can adjust the values in the inputs. You can determine the minimum RSI value and the maximum RSI value.
ADX is used the same way as RSI, you can adjust the value in the inputs. You can determine the minimum ADX value.
Last but not least we use two EMA's, a 200 EMA and 100 EMA. Both are adjustable through the inputs. I used two EMA's because I noticed when using this strategy that we'd enter a new position often after having a bad trade. Using two EMA's might clean up some signals, in my case with EUR/USD on a 15m timeframe, it didn't clean up enough signals.
All the default values are pretty decent but might require some finetuning on a certain instrument. Don't overfit the strategy though, that'll only give you bad signals in the future.
Then we are off to our exit signals.
Initially I wanted to incorporate my previous Bollinger Band exit signals as well, but it was too much of a hassle to make the script work as intended so I left it out. If you want to use those exit signals, just find my other script.
When we're in a position and price crosses the opposite band, we wait for a reverse candlestick before we exit the position.
Additionally we want our losses to be as small as possible, so we use RSI to signal us when the market is, or starts to, trend against us. This is where you use the minimum and maximum exit values. So when RSI crosses over or under that value, it'll exit the position.
Furthermore, we use the ATR indicator to set our stop loss, which is pretty basic stuff. You can adjust the ATR multiplier in the inputs. Disabling "Use Trailing Stop?" is really inadvisable unless you know this script inside out as your only exit signals will be opposite Bollinger Band Cross and RSI overbought / oversold areas.

JFRewards Indi Channel <Heikin> v4.0<>
SOP guidelines only given to JF members .
The ideas are:
1) Finding where to enter position of buying and sell.
2) Finding where is the realistic take profit target within 24 hours with maximum profits.
3) Finding Trailing STOP LOSS, Trailing Take Profit, Take Profit, STOP LOSS.
Fully tested with @Binance Exchanger with numerous of stablecoins and altcoins as well as BTC , ETH.
Performance cannot be shown due to non standard chart of Heikin Ashi.

KISS Strategy: SMA + EMA//Hello my fellow investors
//I am creating a simple non-cluttered strategy that uses 3(+1) simple means to determine: viability, entry, and exit
//1) Has a consistent trend been maintained for several days/weeks
//2) SH SMA crossover LG SMA = Bullish entry/LG SMA crossover SH SMA = Bearish entry
//3) Use the Slope factor & Weeks in Trend (WiT) to dertermine how strong of an entry signal you are comfortable with
//4) Exit position based on next SMA cross and trend reversal or stop loss%
//3+1) For added confidence in trend detection: Apply MACD check - buy--> MACD line above signal line and corssover below histogram \\ sell --> MACD line below signal line and crossover above histogram.
//*)This code also allows you to determine your desired backtesting date compliments of alanaster
The chart shown has:
Starting Capital: $10,000
Investment percent per trade: 1.5%
Stop Loss: 20%
Take Profit: 100%
Gregoire Channel StrategyAdd the strategy to the chart, and start by selecting one of four systems:
1) Trend Following
2) Trend Following - Long Only
3) Volatility Breakout
4) Volatility Breakout - Long Only
Each system is better suited to a particular type of market. Find out through back-testing which system and timeframe is best for each market.
Trend Following is good for securities that strongly trend up and down. Examples: Bitcoin, "growth" stocks.
Trend Following (Long Only) is great for stock indexes that are on a 100 year uptrend, or US-based crypto exchanges which don't allow margin trading but you want to catch the big trends (BTC, ETH).
Volatility Breakout is a defensive system designed to capture the meat of the move and protect the gains. This system is better for altcoins and mature markets like forex pairs.
Volatility Breakout (Long Only) is for US-based crypto exchanges that don't allow margin trading. Good for altcoins.
DEFAULT SETTINGS:
START DATE: 1/1/2020
FEE: 0.1% (This is the Binance.us fee per trade, tailor it to your exchange)
TAKE PROFIT GCW: 0
STOP LOSS GCW: 0
LENGTH: 20
SOURCE: HL2
The system doesn't need stop losses or take profit levels as they are built into the system, but you can add them if you want. 1 GCW = half the channel, so the distance from the top of the channel to the middle line. 2 GCW = the height of the channel.
MISC
-Make sure you calculate the fees! They make a huge difference in profitability. For example, test how Coinbase.com's fees of 0.5% compared to Binance.us's fees of 0.1%. It's huge!
-Try different sets of lengths and timeframes. For example, I like using the daily timeframe and low length for stocks and intraday timeframe with long lengths for crypto. See what tests best!
Disclaimer: past performance doesn't equal future results, this isn't financial advice, this is for entertainment purposes only, consult a professional financial advisor.

Buy the Dips (by Coinrule)Taking your first steps into automated trading may be challenging. Coinrule's mission is to make it as easy as possible, also for beginners.
Here follows the best trading strategy to get started with Coinrule. This strategy doesn't involve complex indicators, yet was proved to be effective in the long term for many coins. Results seem to be improved when trading a coin vs Bitcoin.
The strategy buys the dips of a coin to sell with a profit. A stop-loss protects every trade.
Crypto markets offer high volatility and, thus, excellent opportunities for trading. Excluding times of severe downtrend, buying the dip is a simple and effective long-term trading strategy. The buy-signal is set to a 2% drop in a 30-minutes time frame.
Each trade comes with a take profit and a stop loss. Both set at 2%.
You can adjust these percentages to the market volatility as an advanced setup. You can backtest the outcomes using the backtesting tool from Tradingview
The strategy assumes each order to trade 30% of the available capital. A trading fee of 0.1% is taken into account. The fee is aligned to the base fee applied on Binance, which is the largest cryptocurrency exchange.

Simple and efficient MACD crypto strategy with risk managementToday I am glad to bring you another great creation suited for crypto markets.
MARKET
Its a simple and efficient strategy, designed for crypto markets( btcusd , btcusdt and so on), and suited for for higher time charts : like 1hour, 4hours, 1 day and so on.
Preferably to use 1h time charts.
COMPONENTS
MACD with simple moving average
ENTRY DESCRIPTION
For entries we have :
We check the direction with MACD . Depending if its an uptrend and positive level on histogram of MACD we go long, otherwise we go short.
RISK MANAGEMENT
In this strategy we use a stop loss based on our equity. For this example I choosed a 2% risk .That means if our account has 100.000 eur, it will automatically close the trade if we lose 2.000.
We dont use a take profit level.
In this example also we use a 100.000 capital account, risking 5% on each trade, but since its underleveraged, we only use 5000 of that ammount on every trade. With leveraged it can be achieved better profits and of course at the same time we will encounter bigger losses.
The comission applied is 5$ and a slippage of 5 points aswell added.
For any questions or suggestions regarding the script , please let me know.
